

1. Introduction
2. Data and Methodology
2.1 Measured Data and Quality Control
2.2 Sunshine Duration and Cloud Cover Model
3. Results and Discussion
4. Conclusions
1. Introduction
Solar energy is a clean renewable energy source that is abundant in South Korea. Therefore, the precise measurement of local solar irradiance and easy-to-use solar irradiance estimation model is requested for renewable energy and building energy saving. The horizontal global irradiance data of fourteen cities (Chuncheon, Gangneung, Seoul, Incheon, Suwon, Cheongju, Daejeon, Andong, Deagu, Jeonju, Jinju, Gwangju, Busan, and Jeju) is used to evaluate sunshine fraction radiation model (SFRM) and cloud radiation model (CRM), one based on the sunshine duration (SD) and the other on the cloud cover (CC). They are compared to a statistical SFRM using SD data and a statistical CRM using CC data. In South Korea, while SD and CC data are measured 79 and 42 weather station locations, respectively, solar irradiance is measured only 22 stations.
Jo et al. (2012)1) estimated solar radiation in Korea using The CC and the SD data to predict the daily horizontal global irradiance (HGI). The hourly HGI required the correlation between the SD and the CC data according to the solar altitude that changes with time. The correlation between the measured and the calculated data is compared according to solar altitude. Lee et al. (2013)2) predicted the hourly HGI using the SD and CC for six cities of South Korea during the period (1986-2005). In this study, the two models to predict hourly HGI are estimated this model allows interpretation through physical parameters. This study evaluated the two models using site fitting and South Korea coefficients for fourteen cities of South Korea during the period (1986-2015) and compared the corelation of the measured and calculated data according to the solar altitude of 10 degrees.
2. Data and Methodology
2.1 Measured Data and Quality Control
All data ffor fourteen cities of South Korea during the period (1986-2015) were measured by the Korea Meteorological Administration (KMA). Currently, there is a central meteorological office, five regional offices, and 73 weather stations, totaling 79 weather stations. Hourly SD and CC data recorded during the daytime over 30 years period (from 1986 to 2015) were gathered for analysis. The 3-hour CC data were linearly interpolated into 1-hour data. The hourly HGI data, which is the value accumulated for 1 hour, was corrected the average value of the current and subsequent hours. Using the site fitting and South Korea coefficients from this process, the fourteen different locations whose different distances can be seen in Fig. 1, Table 1 showed the characteristics of measured data for the fourteen cities.
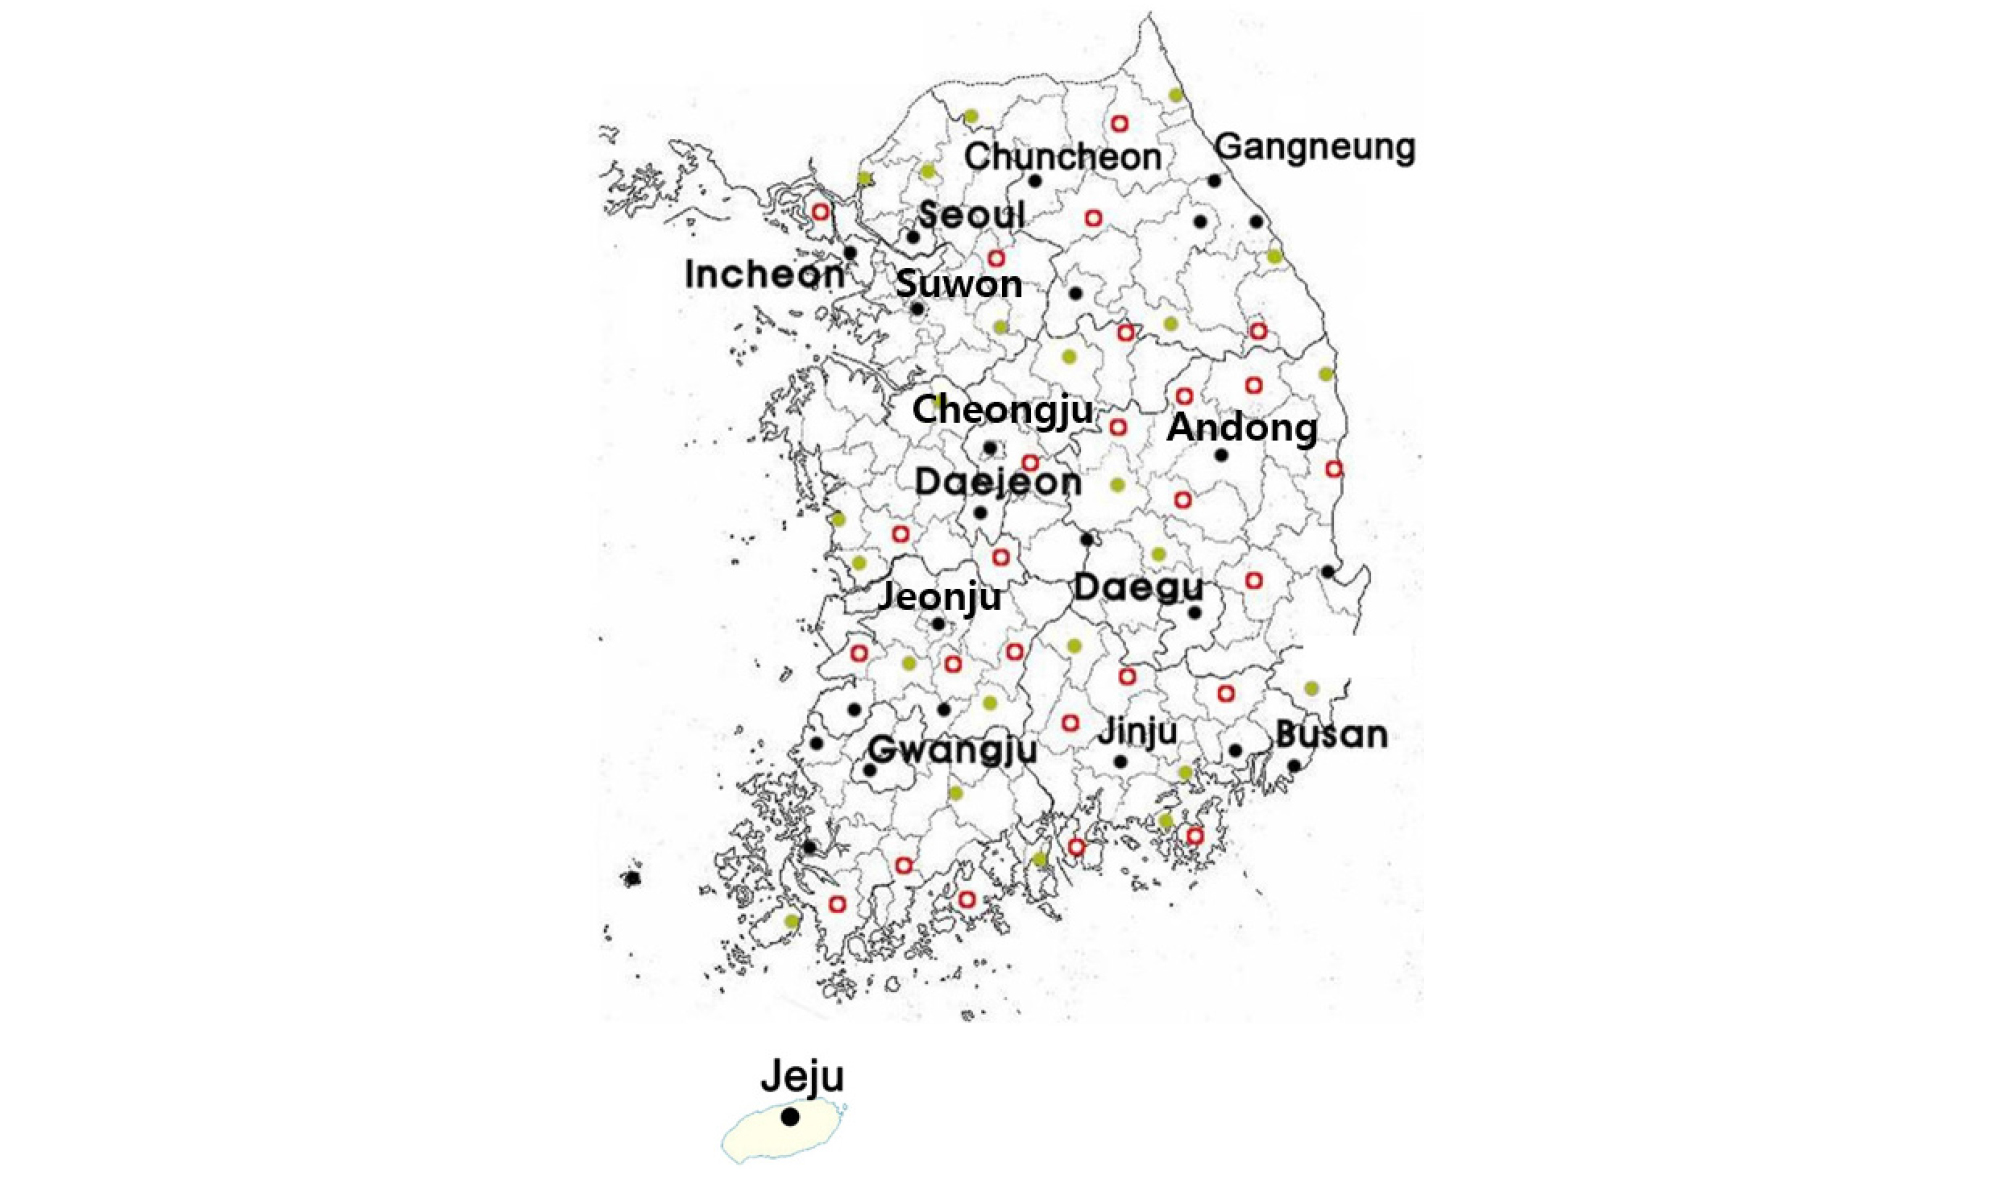
Table 1 Geographical data and weather database for locations considered in this study
The irradiance data has been checked for continuous data sets without gaps and simulation purposes. The missing data had to be filled using quality control of Muneer and Fairooz (2002)3), Younnes et al. (2005)4), and Lee et al. (2013) method. This study used the following criteria of quality control:
∙missing irradiance data,
∙global hourly data that are greater than the corresponding extraterrestrial solar irradiance,
∙hourly data with a solar altitude lower than 5° (low accuracy measurements)
The error percentages of quality control ranged from 5.37% (Cheongju) to 7.14% (Incheon) for fourteen cities as in Table 1.
2.2 Sunshine Duration and Cloud Cover Model
The solar irradiance is mainly determined by the sky condition and it may be quantified by means of the clearness index and the two models predict hourly clearness index for South Korea coefficients. The South Korea clearness index derived from 13 cities except Jeju is shown in Table 2 and Table 3. The clearness index for South Korea coefficients, kt is defined as:
| $$k_t=\frac{H_t}{I_o}$$ | (1) |
Table 2 Clearness index with sunshine duration and solar altitude (1986-2015) for South Korea coefficients
Table 3 Clearnness index with cloud cover and solar altitude (1986-2015) for South Korea coefficients
The Angström(1924)5) proposed monthly average daily radiation to clear day radiation and Ogelman et al. (1984)6)6) have correlated (H/Ho) with (S/So) using the polynomial equation. Lee et al.(2013) modified the original model to predict hourly global solar irradiation for 6 meteorological stations in South Korea. The original Angström-type regression equation related monthly average daily radiation to clear day radiation at the location in question and the average fraction of possible sunshine hours.
| $$\frac H{H_o}=a+b\left[\frac S{S_o}\right]$$ | (2) |
Coefficient values a and b for Eq.2 were calculated by regression analysis. The sunshine fraction, SF (t), as a function of solar altitude is given by Lee et al. (2013):
| $$I(t)=I_0\times\sinh(c+d\times SF(t))$$ | (3) |
Coefficients c and d for fourteen cities were shown in Table 4. Site fitting coefficients are regional coefficients, and South Korea coefficients are coefficients calculated using CC and SD in thirteen cities except for Jeju. The coefficients of SFRM for South Korea are derived by the clearness index from the CC and HGI data in 13 cities except for Jeju (184).
Table 4 Coefficients of SFRM for site fitting and South Korea (1986-2015)
Kasfourteen and Czeplak (1980)7) estimated solar irradiance based on cloud cover for 10 years period (1964-1973) in Hamburg, Germany. Younes and Muneer (2006)8)modified Kasfourteen and Czeplak (1986) equations for the different datasets. Lee et al. (2010)9) used the method with 20 years of data (1986-2005) for 6 meteorological stations in South Korea.
| $$I_{GC}=A\;\sin\;\mathrm h-B$$ | (4) |
| $$I_G=I_{GC}(1-C(N/8)^D)$$ | (5) |
The coefficients (A, B, C, and D) were calculated using the data from the same fourteen cities of Fig 1. (See Table 5) The coefficients of CRM for South Korea are derived by clearness index from the CC and HSI data in 13 cities except for Jeju (184).
Table 5 Coefficients of CRM for site fitting and South Korea (1986-2015)
The two models were evaluated using the root mean square error (RMSE) and the mean bias error (MBE). The strength of correlation r2 of site fitting and South Korea coefficients varied within similar ranges: 0.833 ~ 0.871 for CRM and 0.863~0.917 for SFRM (see Tables 4 and 5). The overall averages of fourteen sites fitting location were 0.854 and 0.853 for CRM, respectively, and 0.898 and 0.896 for SFRM, respectively. The difference in the correlation between the site fitting and South Korea coefficients was very small similar to Lee et al. (2013) studies.
3. Results and Discussion
The method of comparison is used the mean bias error (MBE) and root mean square error (RMSE) for the fourteen cities. The MBE shows the long-term performances and a negative MBE value indicates the amount of underestimation. The RMSE shows the short-term performances and the amount of the errors indicates the scattering of data around the regression.
Table 6 summarizes the error of the two models with site fitting and South Korea coefficients to estimate HGI for fourteen cities listed in Table 1. The CRM has a smaller MBE in all locations and the SFRM has a smaller RMSE in all locations same as Lee et al. (2013). The MBE of site fitting coefficients varied small ranges: -1.61% ~ 2.56% (Seoul) for the CRM and 2.08% ~ 8.95% (Seoul) for the SFRM, but the MBE of South Korea coefficients varied considerable ranges: -20.90% (Seoul) ~ 10.18% (Jinju) for the CRM and –5.69% ~ 11.81% (Jinju) for the SFRM. The RMSE of site fitting coefficients varied small ranges: 26.64% ~ 30.39% for the CRM and 21.19%~26.53% for the SFRM, and the RMSE of South Korea coefficients varied similar ranges of site fitting coefficients: 26.52% ~ 30.98% for the CRM and 22.31% ~ 27.92% for the SFRM. The overall averages RMSE of the site fitting and the South Korea coefficients were 26.61% and 28.83% for the CRM, respectively, and 24.13% and 24.38 for the SFRM, respectively. Comparing the error of two models in Table 6, we can see that the CRM with site fitting coefficients and the SFRM with site fitting and South Korea coefficients are a good method to protect hourly HGI. Compared to the results of this study and six cities of South Korea during 20 years, the MBE and the RMSE improved 6.71% and 5.62% for the CRM, respectively, and 2.94% and 6.28 for the SFRM, respectively. This improvement is due to an increase of 10 years of measurement data and the correction of hourly HGI data.
Table 6 Error of two models with site fitting and South Korea coefficients
The MBE of the two models according to the solar altitude of 10° were shown in Fig. 2 and Fig. 3. Comparing the MBE of the site fitting coefficients, the average MBE was similar (see Table 6), but the CRM difference of MBE was more than three times for the solar altitude below 25° and about two times above 25°. The MBE of the South Korea coefficients of the CRM and the SFRM showed a similar tendency to site fitting coefficients. The largest MBE regions in the site fitting and South Korea coefficients were Jeju (184) and Seoul (108) for CRM, respectively, Jeju (184) and Busan (159) for SFRM, respectively. The SFRM of site fitting coefficients in this study has a smaller error of MBE for all solar altitudes. The CRM of site fitting coefficients at the solar altitude above 35° and the SFRM of South Korea coefficients at all solar altitudes are also good alternatives for the generation of hourly HGI.
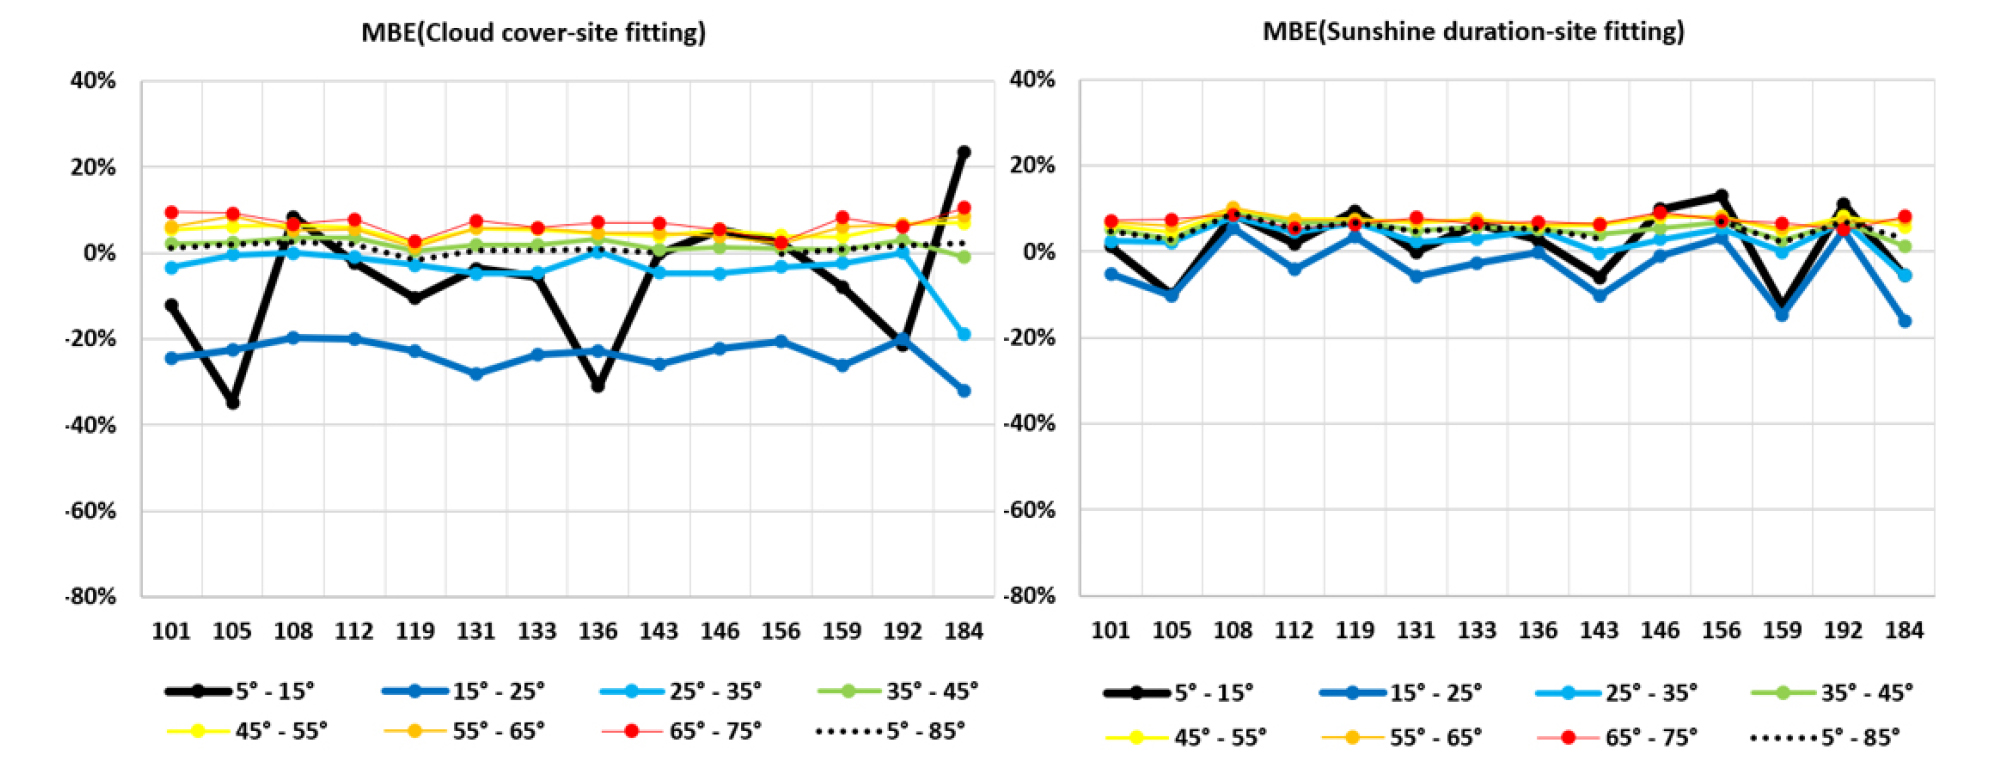
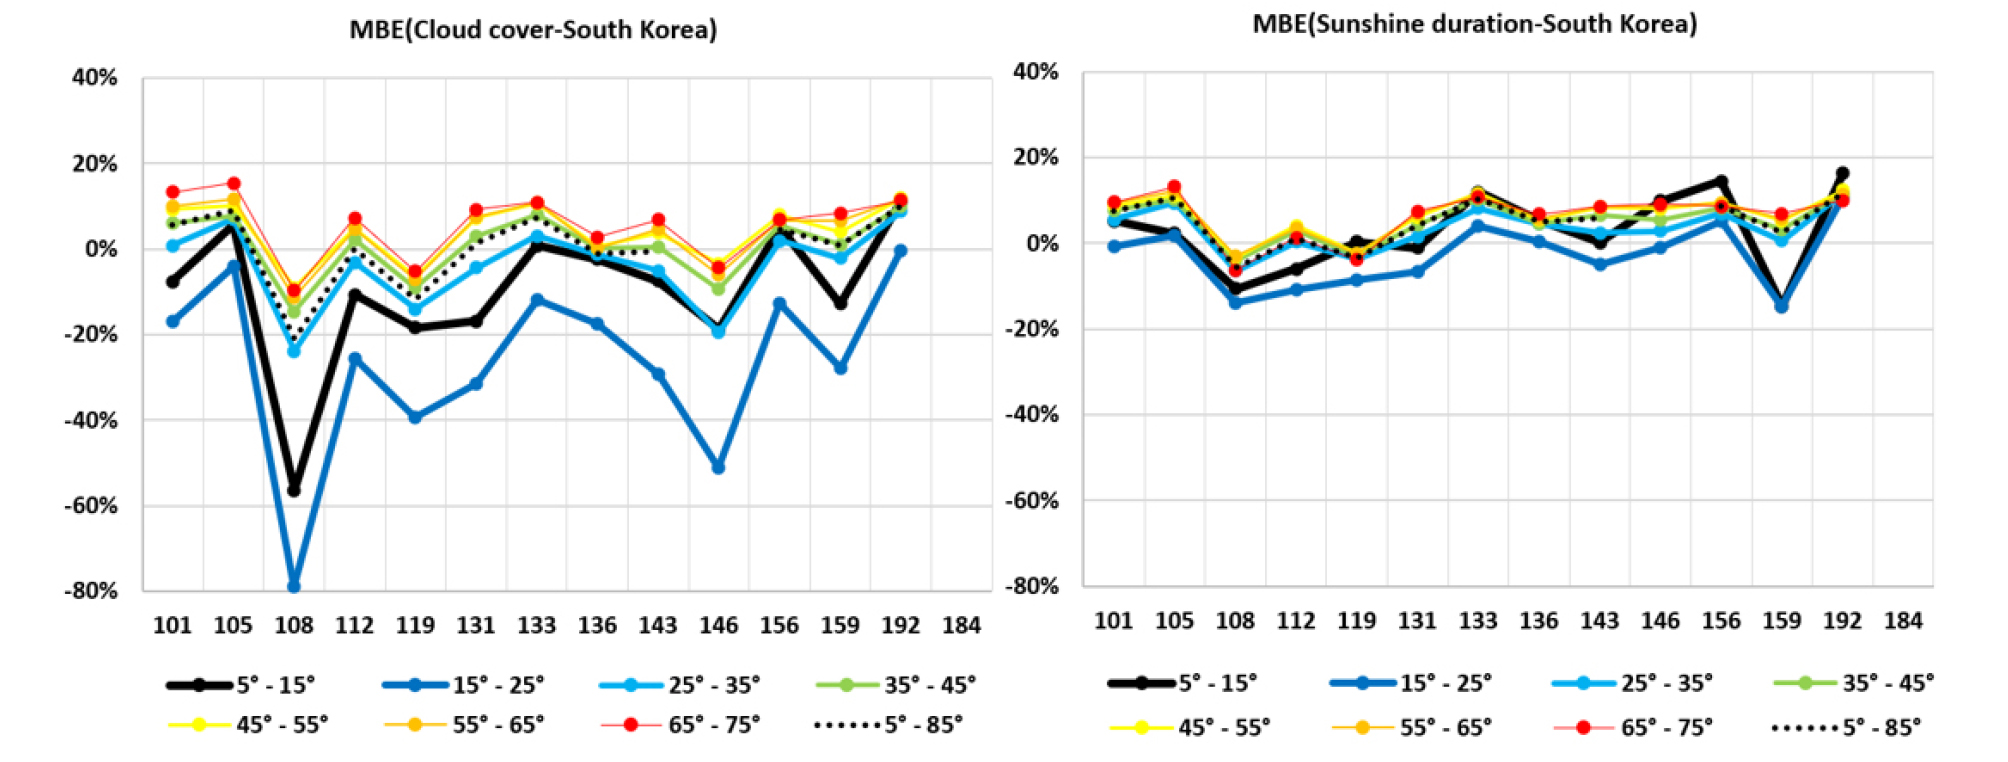
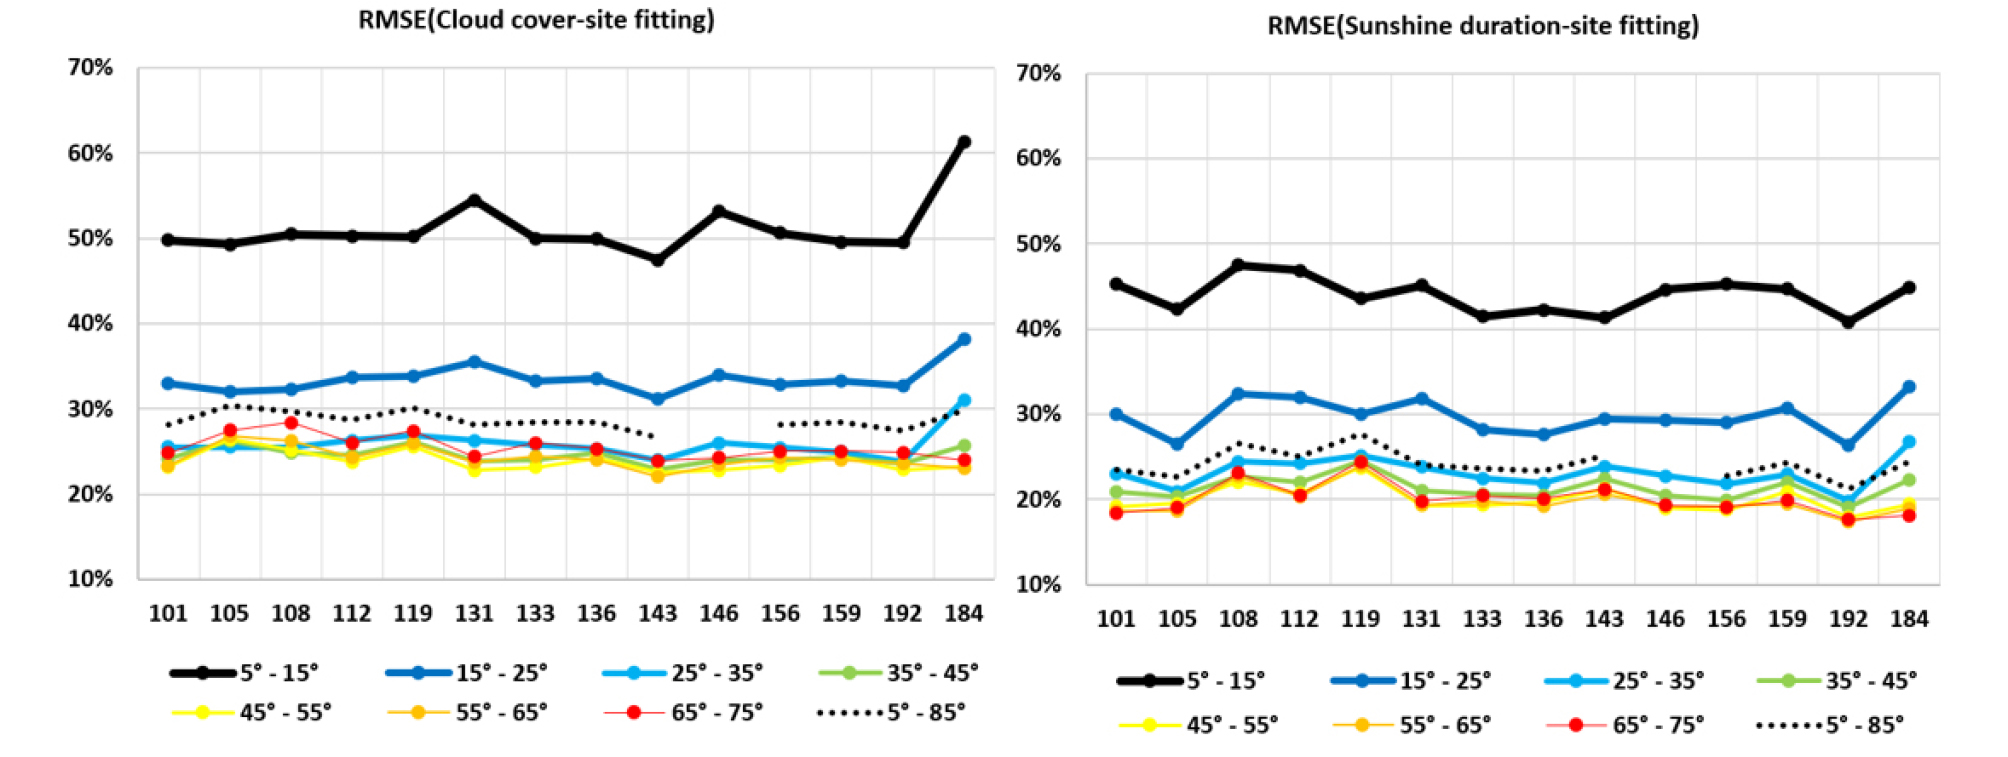
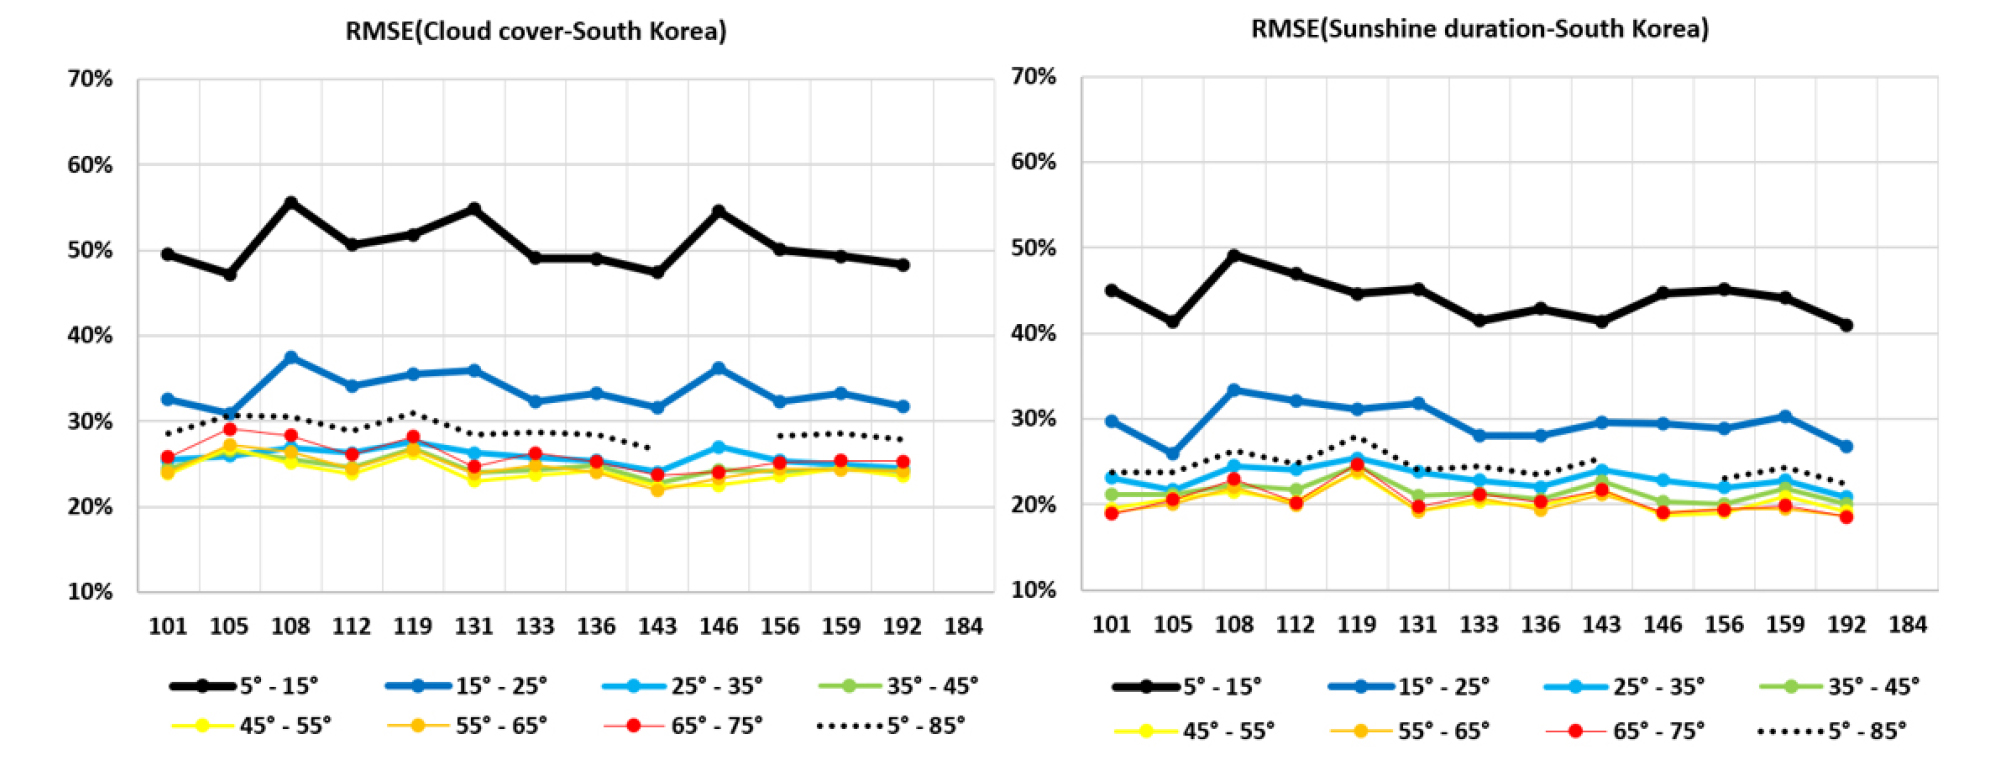
Fig. 4 and Fig. 5 showed the variation of the errors of RMSE according to the solar altitude for site fitted and South Korea coefficients. Comparing the RMSE of the site fitting coefficients between the CRM and the SFRM, the difference was about 5% for all solar altitudes. The RMSE of the South Korea coefficients of the CRM and the SFRM showed a 5% difference as site fitting coefficients. In all cases, the errors of RMSE decreased with increasing solar altitude. It can be seen that RMSE increases to 70% at 10° of solar altitude and decreases to 25% over 30° for the SFRM model. The largest RMSE regions in the site fitting and South Korea coefficients were Jeju (184) and Seoul (108) for the CRM model, respectively, Seoul (108) and Seoul (108) for SFRM, respectively. The SFRM of the site fitting coefficients in this study has a smaller error of RMSE for all solar altitudes. The SFRM model of South Korea coefficients at all solar altitudes are also good alternatives for the generation of hourly global solar irradiation. From the variation of the errors of MBE and RMSE, it is found that the SFRM with the site fitting coefficients could be the best method for fourteen locations. The SFRM models of South Korea coefficients generated in this study may be used reasonably well for calculating the hourly horizontal global irradiance (HGI) at any other location of South Korea.
4. Conclusions
Solar irradiance measurements are not easy for the expensive measuring equipment and precise measuring technology. The hourly HGI was calculated using the SFRM and CRM of SD and CC for the fourteen cities in South Korea. This study compared the hourly HGI and two models according to the solar altitude using hourly SD and CC data. Results of cloud cover and sunshine fraction models have been compared with the measured data on the r2, MBE, and RMSE. The difference in the correlation between the site fitting and South Korea coefficients was very small, similar to previous studies. Comparing the error of two models, we can see that the CRM with site fitting coefficients and the SFRM with site fitting and South Korea coefficients are a good method to protect hourly HGI. Compared to the results of this study and six cities of South Korea during 20 years, the MBE and the RMSE improved 6.71% and 5.62% for the CRM, respectively, and 2.94% and 6.28 for the SFRM, respectively. Therefore, further study is required to increase the measurement period and correct the Hourly HGI.
We analyzed the variation of MBE and RMSE according to the solar altitude of 10° for the CRM and the SFRM. Comparing the MBE of the site fitting coefficients, the average MBE was similar, but the CRM difference of MBE was more than three times for the solar altitude below 25° and about two times above 25°. Comparing the RMSE of the site fitting coefficients between the CRM and the SFRM, the difference was about 5% for all solar altitudes. The RMSE of the South Korea coefficients of the CRM and the SFRM showed a 5% difference as site fitting coefficients. From the variation of the errors of MBE and RMSE, it is found that the SFRM with the site fitting coefficients could be the best method for fourteen locations. The SFRM models of South Korea coefficients generated in this study may be used reasonably well for calculating the hourly horizontal global irradiance (HGI) at any other location of South Korea. Further research is the optimization of South Korea coefficients and the expansion of the research scope to 22 cities.
기호설명
A, B, C, D : Coefficients for cloud cover model
a, b, c, d : Regression coefficients of sunshine duration
h :Solar altitude (Degree)
H :Monthly average daily global radiation on a horizontal surface, (W/m2)
He :Estimation value of global solar irradiance, (W)
Ho :Monthly average daily extraterrestrial solar radiation on a horizontal surface, (W/m2)
Ht :Hourly global solar irradiance on a horizontal surface, (W/m2)
G :Global irradiance
IG :Total global horizontal irradiance, (W/m2)
Io :Extraterrestrial irradiance, (1367 W/m2)
IGC :Clear sky global horizontal irradiance, (W/m2)
kt :Clearness index (0~1)
MBE : Mean bias error, (%)
N :Cloud cover (Octa)
r2 :Coefficient of determination
RMSE : Root mean square error, (%)
S :Monthly average daily hours of bright sunshine, (h)
So :Monthly average daily length of bright sunshine, (h)
SF(t) :hourly sunshine fraction
